The main engagement
The data foundation
Four to eight weeks for your data to live in one place, historised and reliable. Delivered in usable stages, not in one go six months out.
What a foundation actually is
A foundation is not a dashboard tool. It is what sits underneath: connectors that pull data out of your systems, a warehouse that stores and historises it, and a model that says what each figure means. Putting a reporting tool on unprepared data is painting a façade with no wall behind it.
It is also what makes everything after it possible without starting over. Automated reports, alerts and the assistant all plug into the same foundation: each new need then costs days rather than weeks.
What you open in the morning
The dashboards delivered with the foundation, on mobile and desktop. The figures come from the warehouse, and the last sync time is shown under each source.
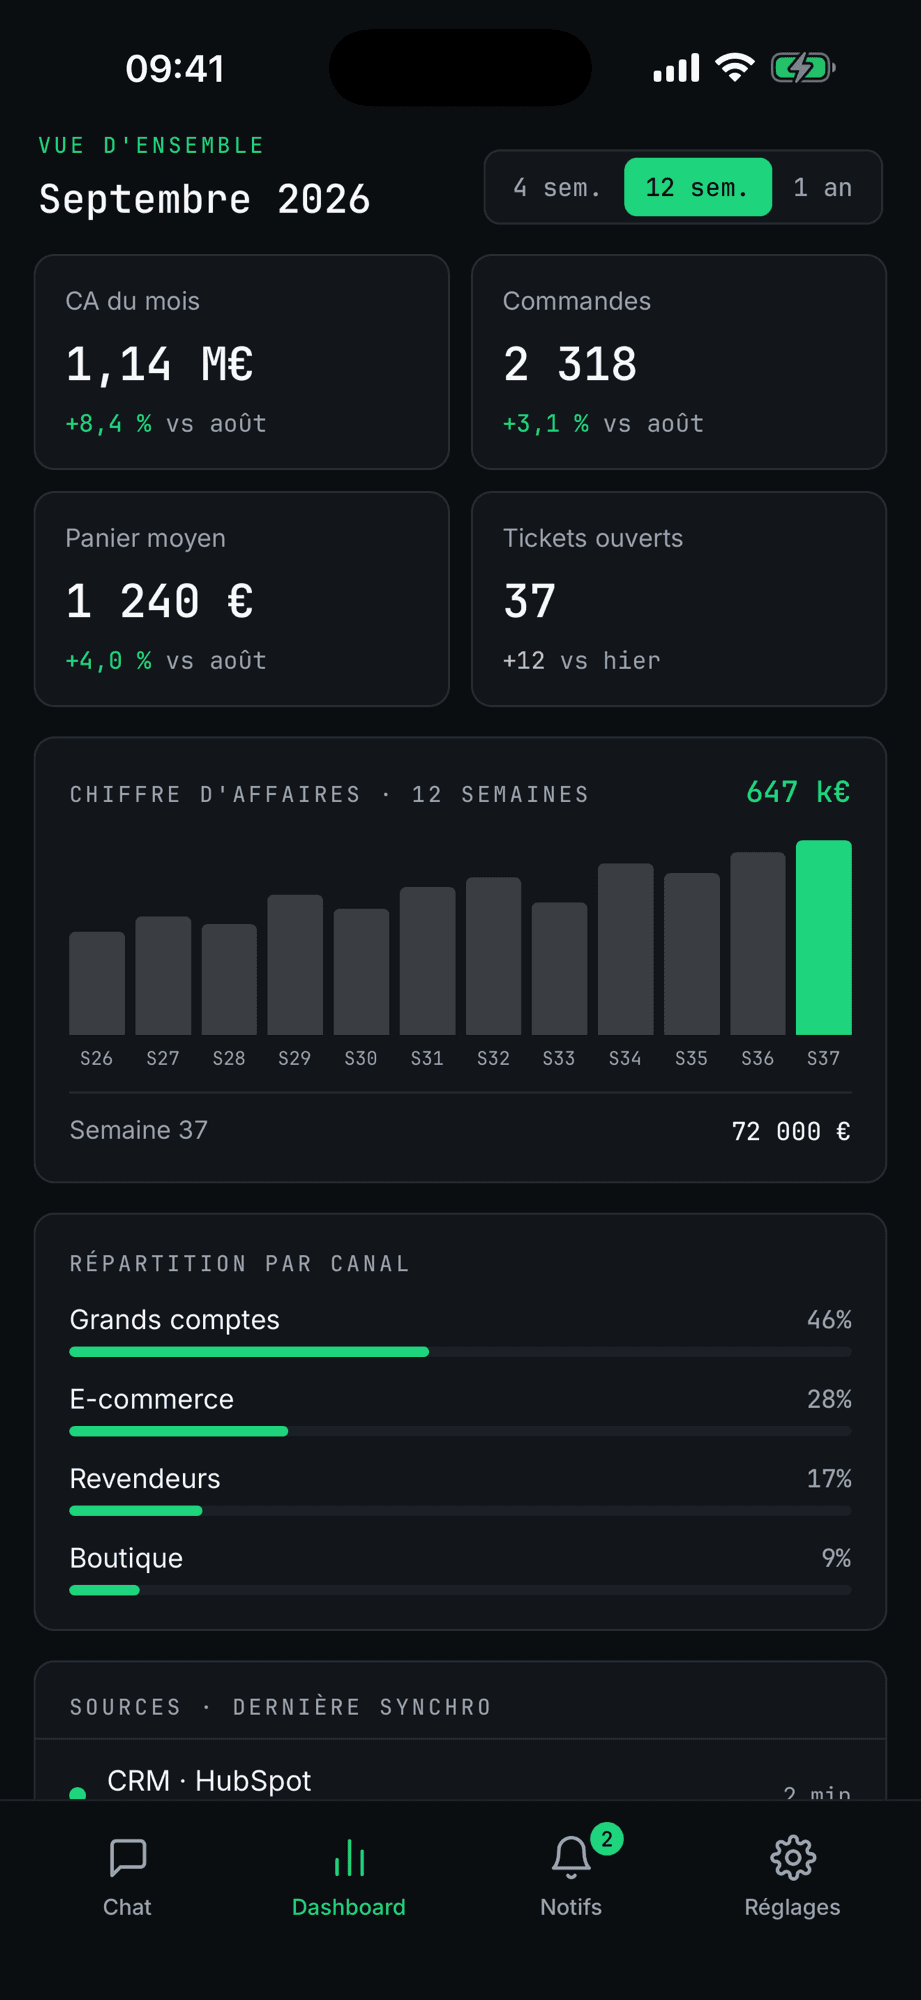
The four figures that matter, the twelve-week trend, and the last sync time of every source.
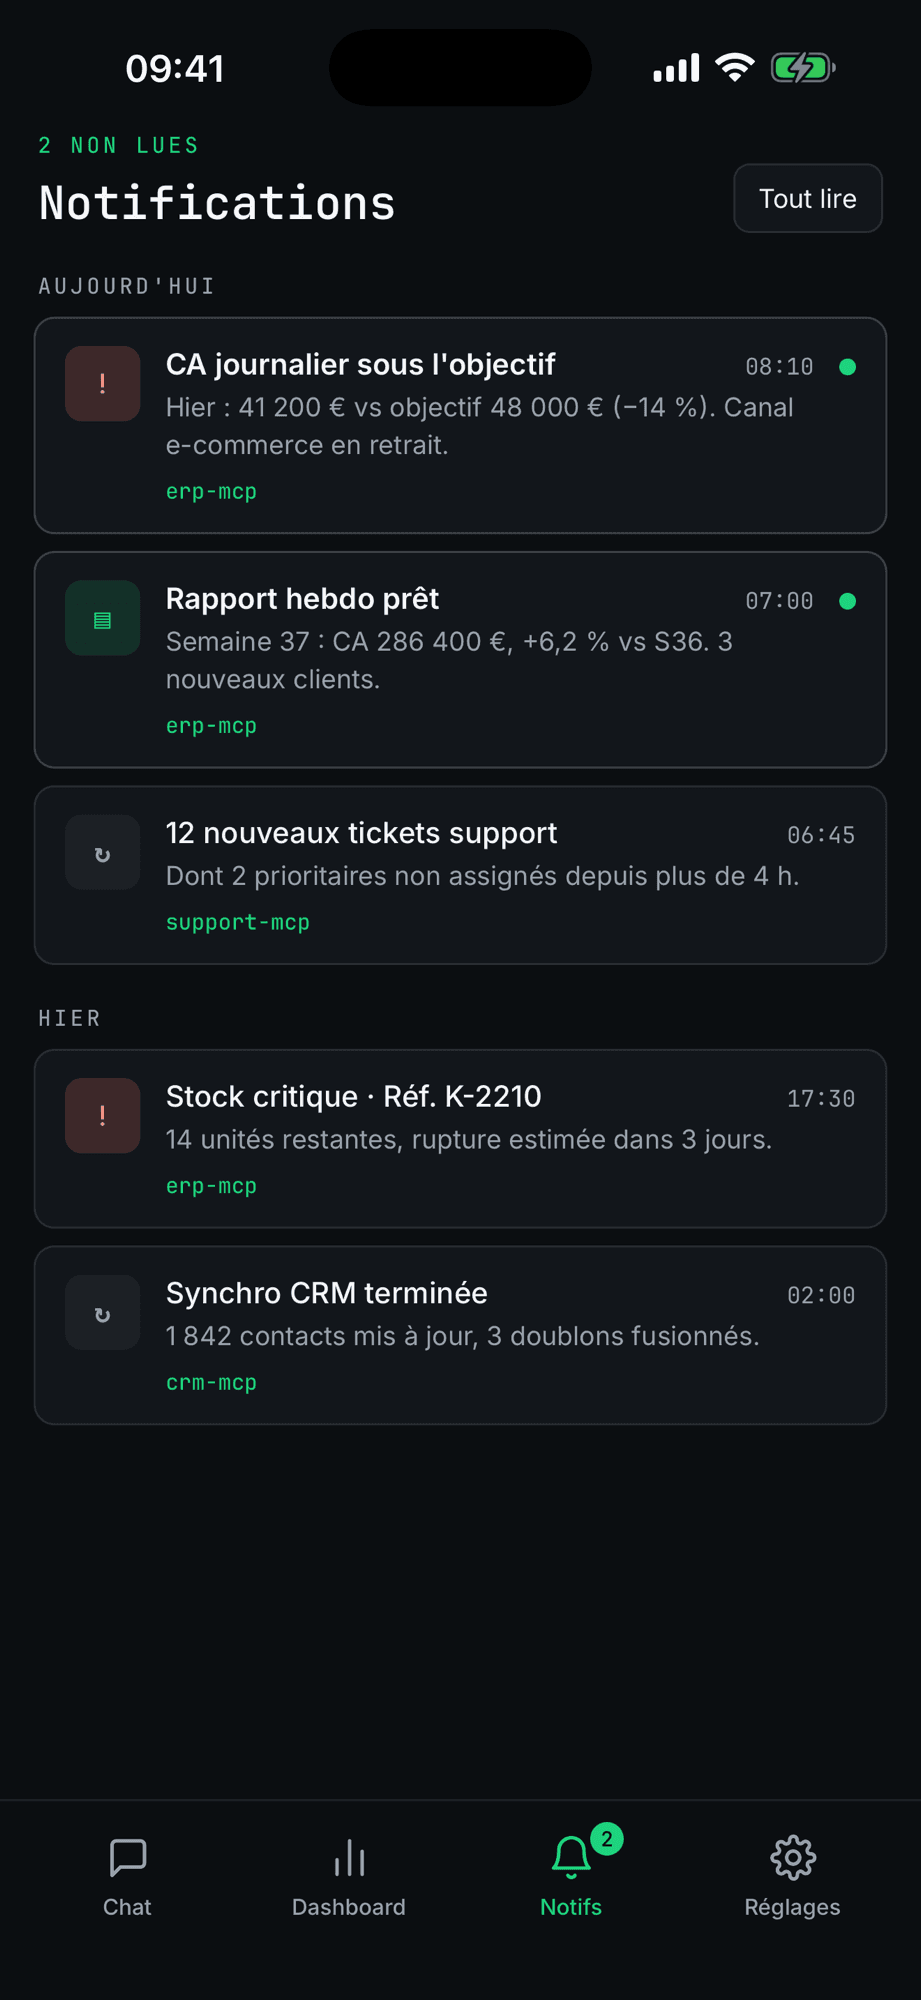
Deviations surface on their own, at the hour they appear. Each alert names the source that produced it.
How it is built
- 011 to 2 weeks
Connectors and collection
One connector per source, scheduled, replayable and logged. We start with the sources behind the three questions identified in the audit, not with the easy ones.
- 021 to 2 weeks
Data model and definitions
Your business entities are reconciled across systems, and every indicator gets a single definition, written and validated with you. This is the step that ends the two dashboards that disagree.
- 031 week
History and controls
The warehouse keeps the state of your data over time, and automatic controls flag breaks: a source that stops answering, a volume that collapses, an identifier that changes format.
- 041 to 2 weeks
First dashboards in production
The views that answer the scoped questions, on desktop and mobile, fed automatically. From then on, nobody builds reporting by hand.
What you receive
- A PostgreSQL warehouse hosted in Europe, whose access you hold.
- One connector per source, scheduled and replayable, with its execution log.
- A documented data model, and a dictionary of indicators: one figure, one definition.
- The dashboards answering the agreed questions, in production.
- Freshness and consistency controls, with the matching alerts.
- The code, the schemas and the documentation, handed over as we go.
What makes a foundation drift
Definitions nobody settled
If sales and finance do not count revenue the same way, no amount of engineering will settle the disagreement. We force the decision before writing code, and we write it down.
Sources without a stable identifier
Reconciling two systems means recognising the same client on both sides. When the identifier does not exist, it has to be built, and that work is quoted separately rather than discovered midway.
Wanting to plug everything in at once
A foundation trying to absorb twelve sources before producing anything never ships. We deliver in usable stages: three sources answering a real question beat twelve half-integrated ones.
Price and timeline
Between €10,000 and €30,000 depending on the number of sources and the state of the data, quoted precisely at the end of the audit. Four to eight weeks. On top of that sits a monthly infrastructure cost, which we size and monitor.
The other engagements
The data audit
Two weeks at most, a fixed price, and a document that belongs to you. It is the only honest way to know what your data allows before committing a budget to it.
The AI assistant
An assistant that answers your business questions in plain language, on figures that come out of your own database. It arrives once the foundation is reliable, never before.
Already have the audit, or know what it would say?
Thirty minutes is enough to size the engagement and its order of magnitude.