ettc Data · Mobile app
Your figures in your pocket, with their source.
ettc Data is the app we deliver with the data foundation and the AI assistant. A chat that answers on your figures, the dashboards you open in the morning, and alerts that warn you when a gap appears. In your colours, for internal use.
Mobile and web · in your colours · delivered with our engagements
What it does
- A chat wired into your systems through MCP servers, in plain language.
- Under every answer, the query actually run against the warehouse and how long it took: the figure can be checked.
- The foundation's dashboards, with the last sync time of every source.
- Alerts that give the gap, the source and a way to dig in, in the chat or the dashboard.
- A scope visible from the first screen: the questions covered, and the source answering each one.
- On mobile and on the web, in your colours, with cost tracked per conversation.
What it looks like
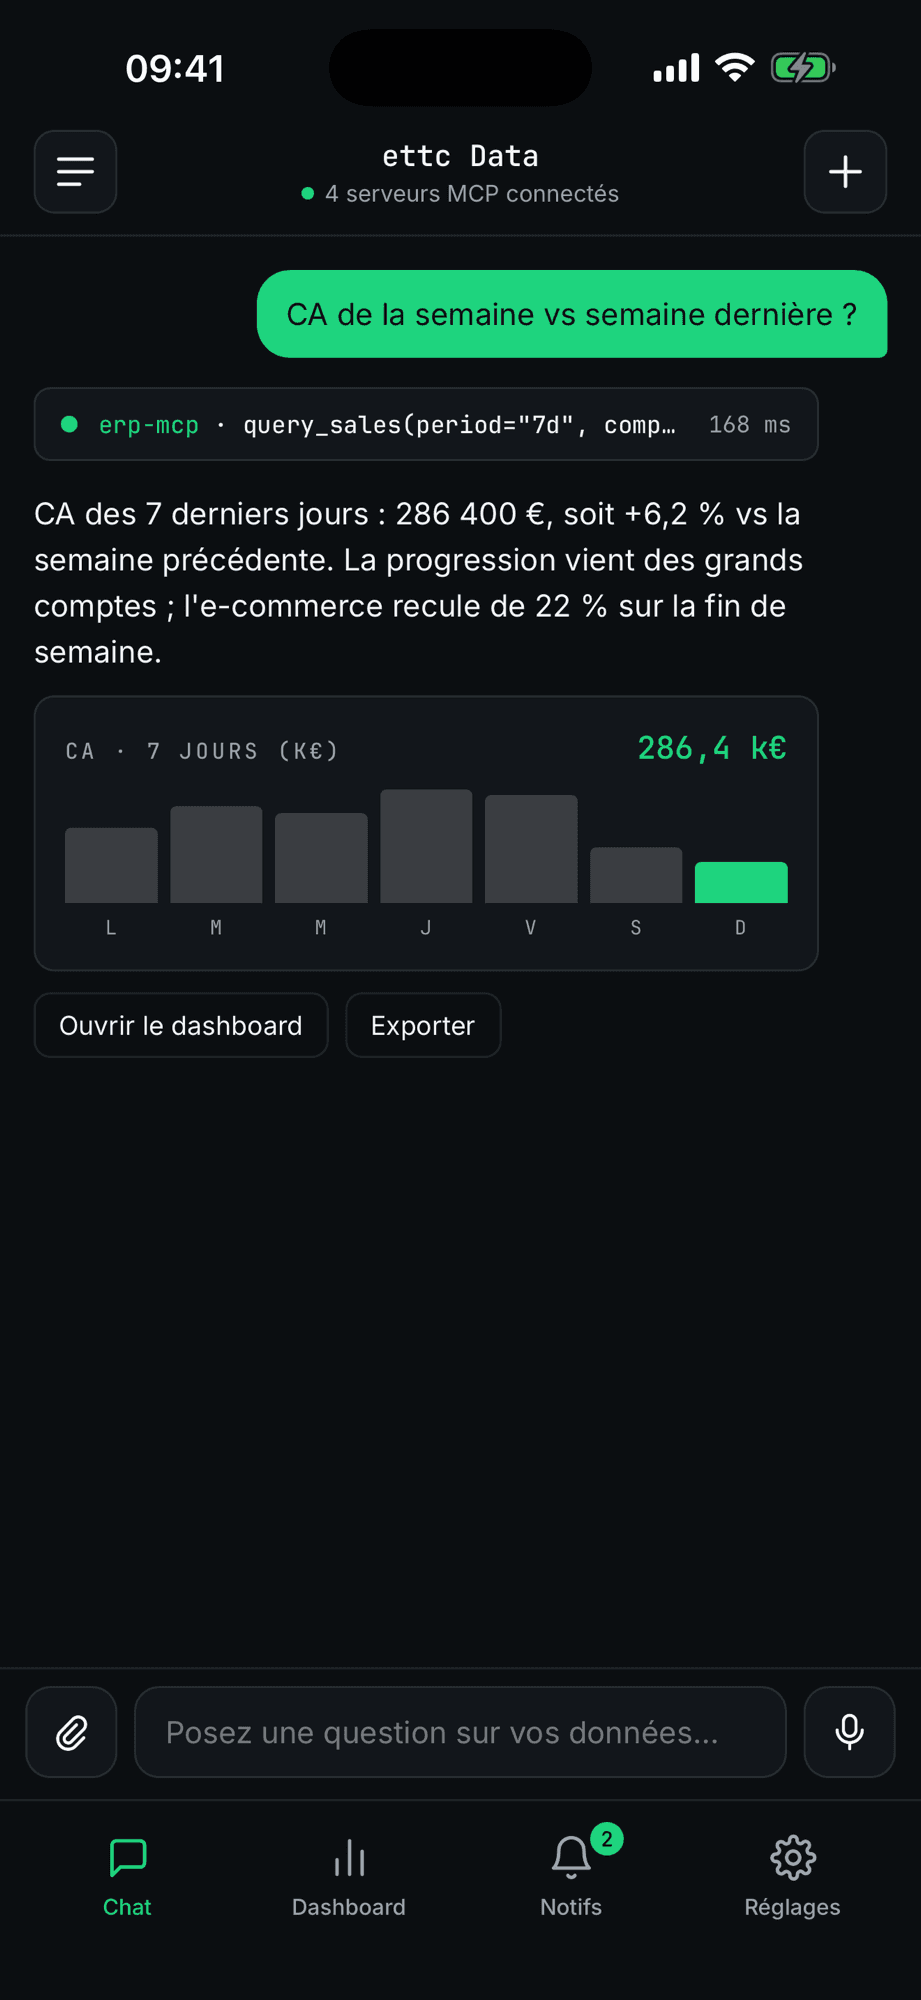
The grey line under the question is the query actually run against the warehouse, with its duration. The figure on screen comes straight from it.
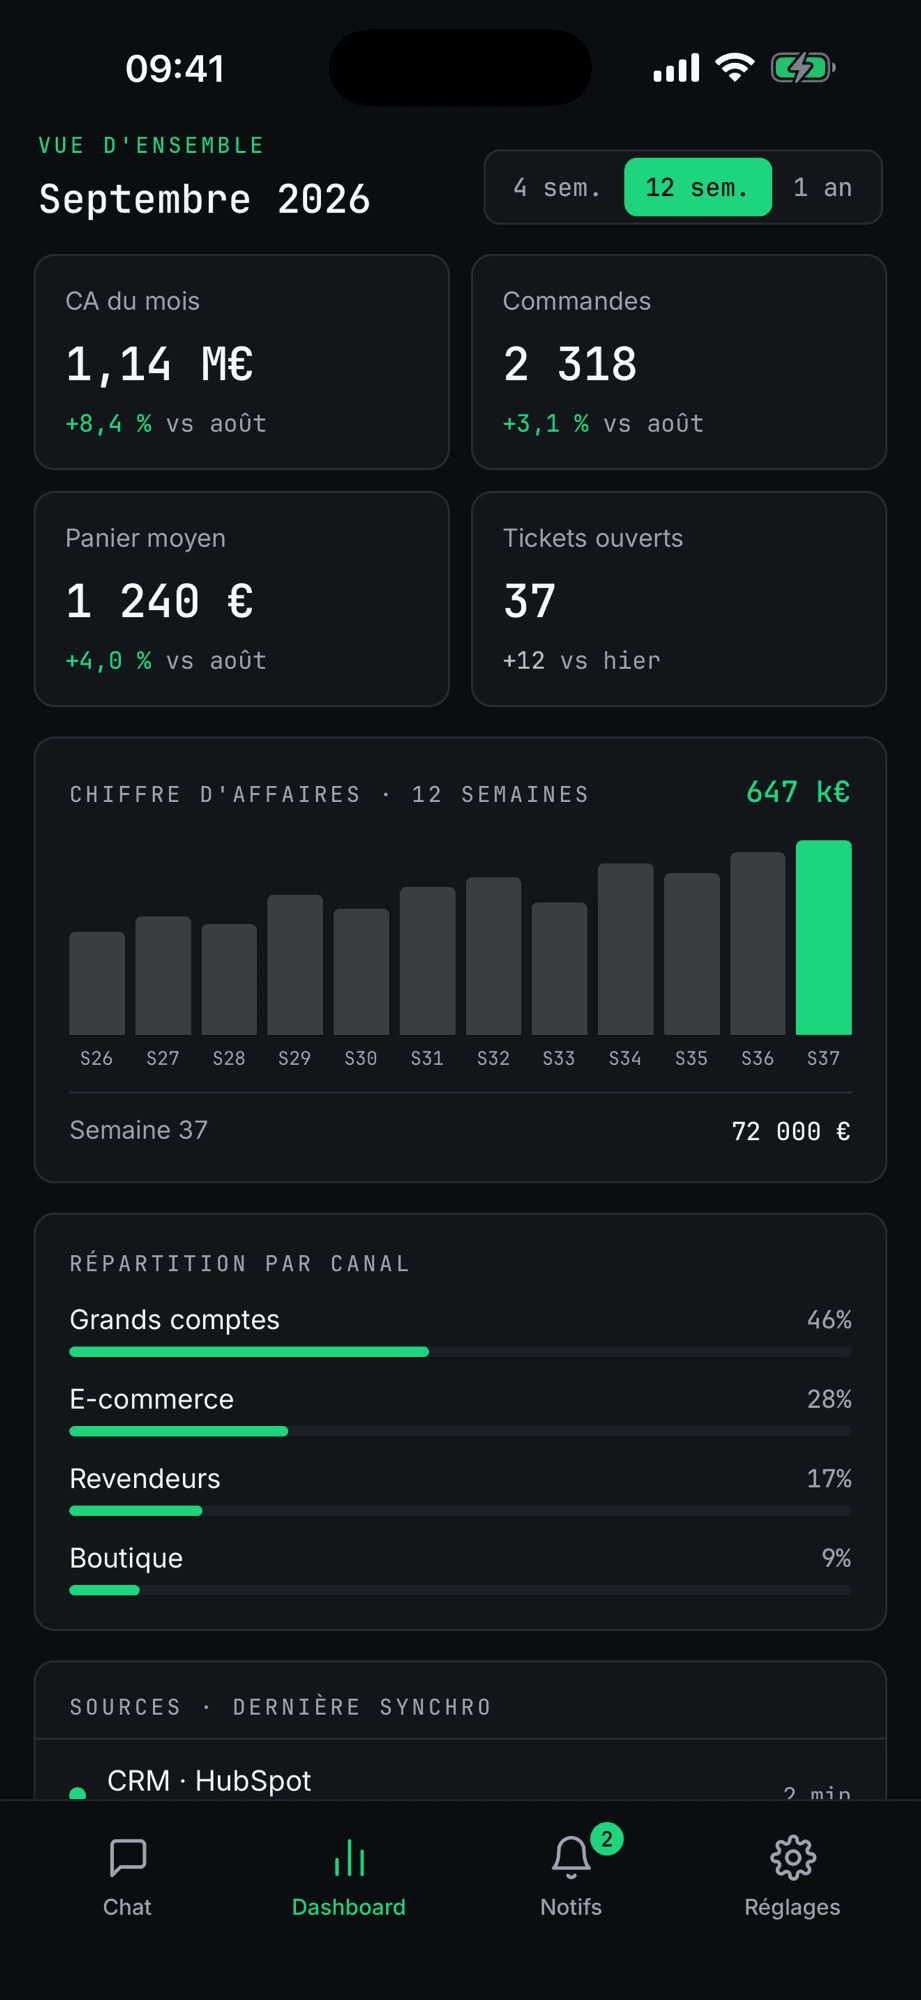
The four figures that matter, the twelve-week trend, and the last sync time of every source.
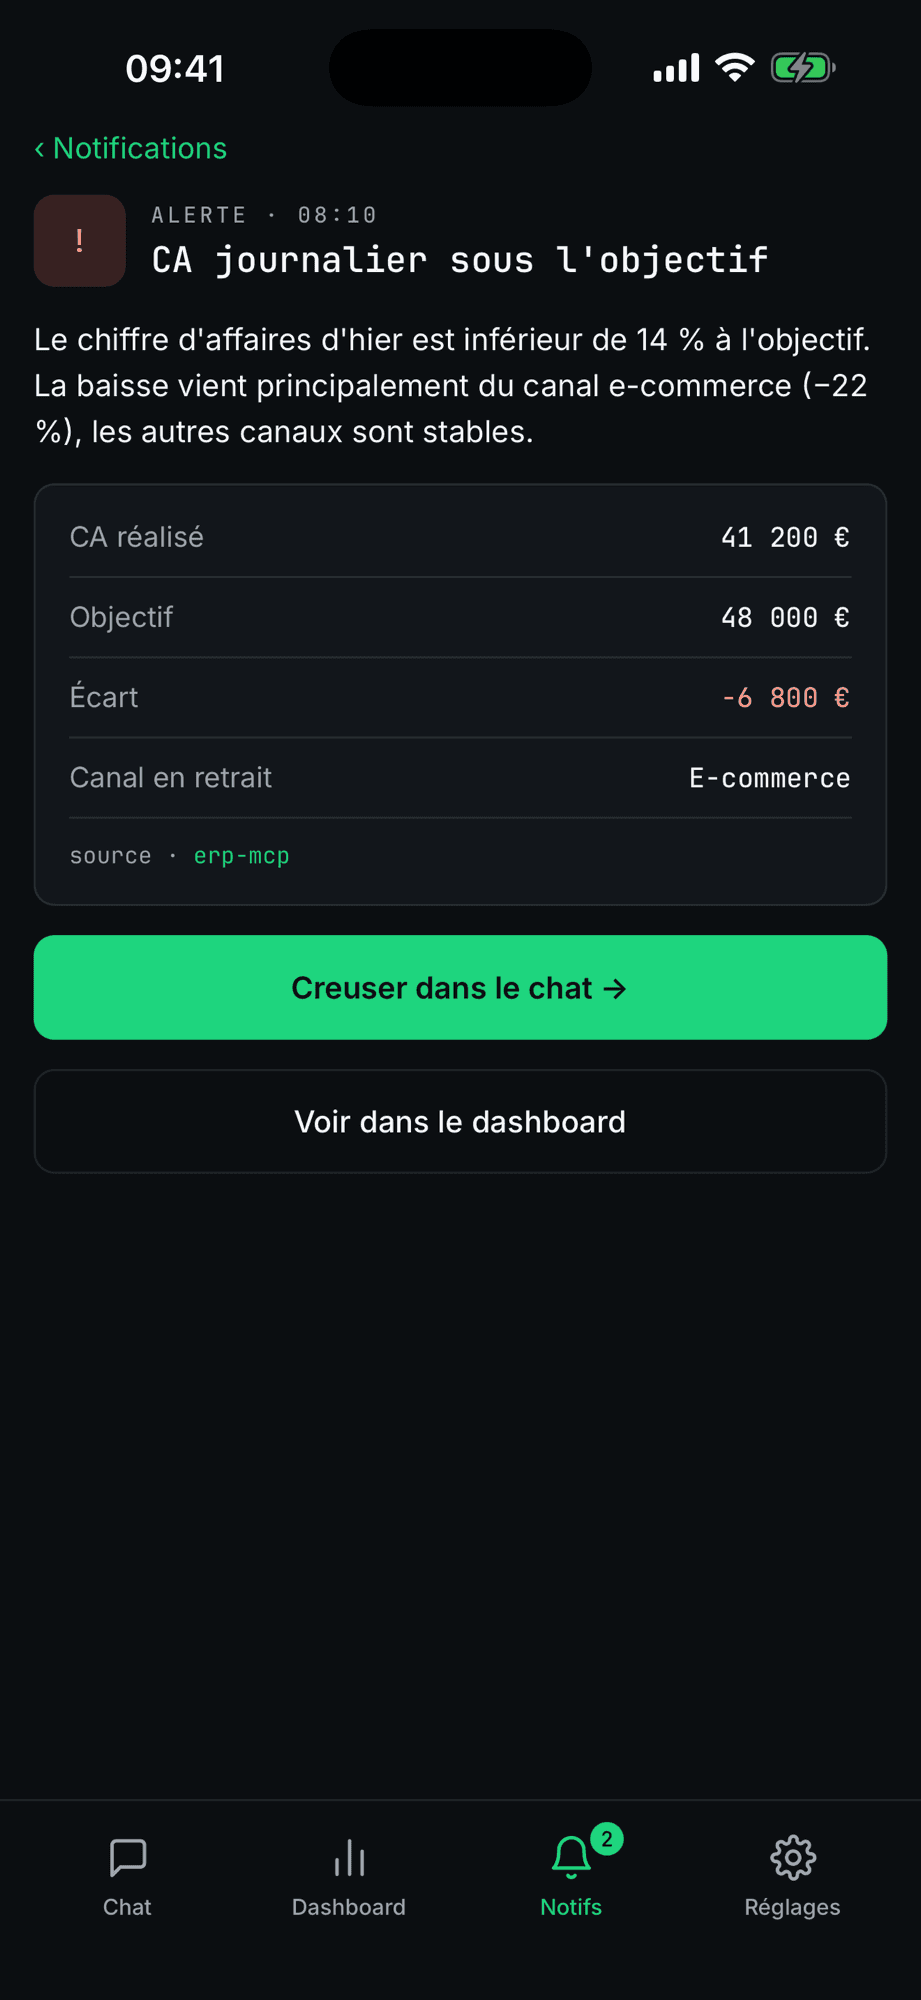
An alert does not just flag: it gives the gap, the likely cause, the source, and a way to dig in straight away.
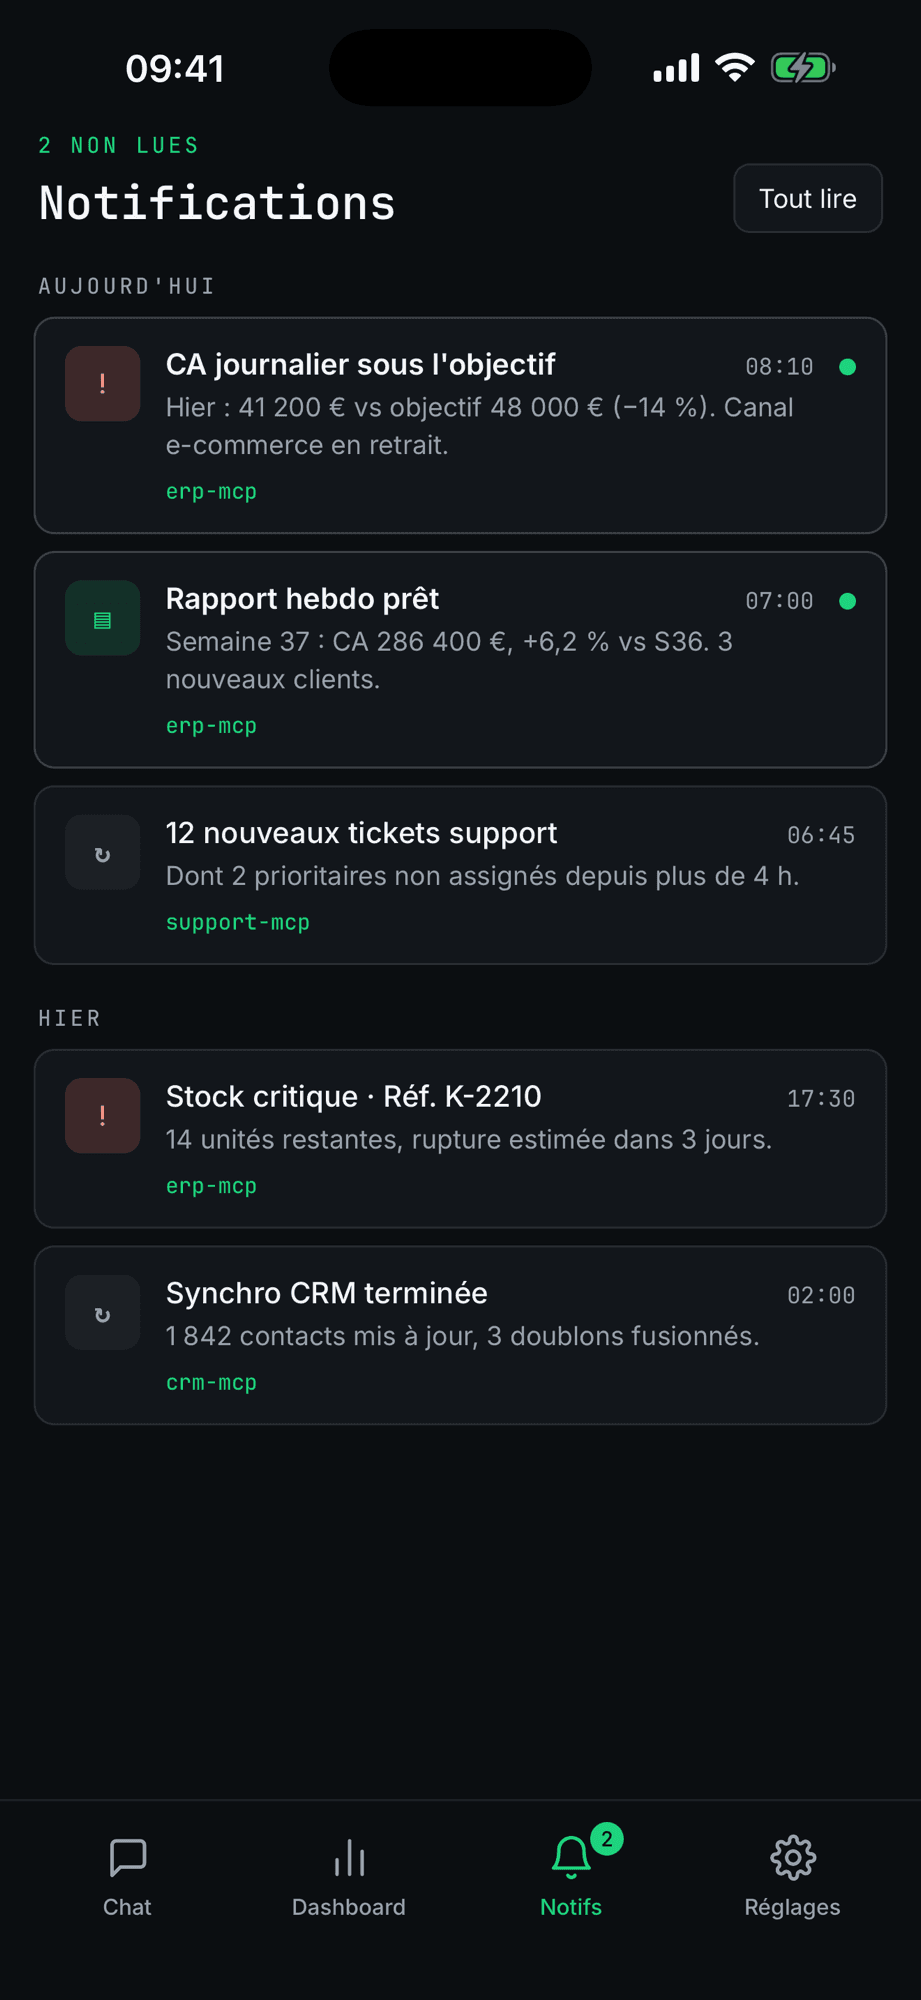
Deviations surface on their own, at the hour they appear. Each alert names the source that produced it.
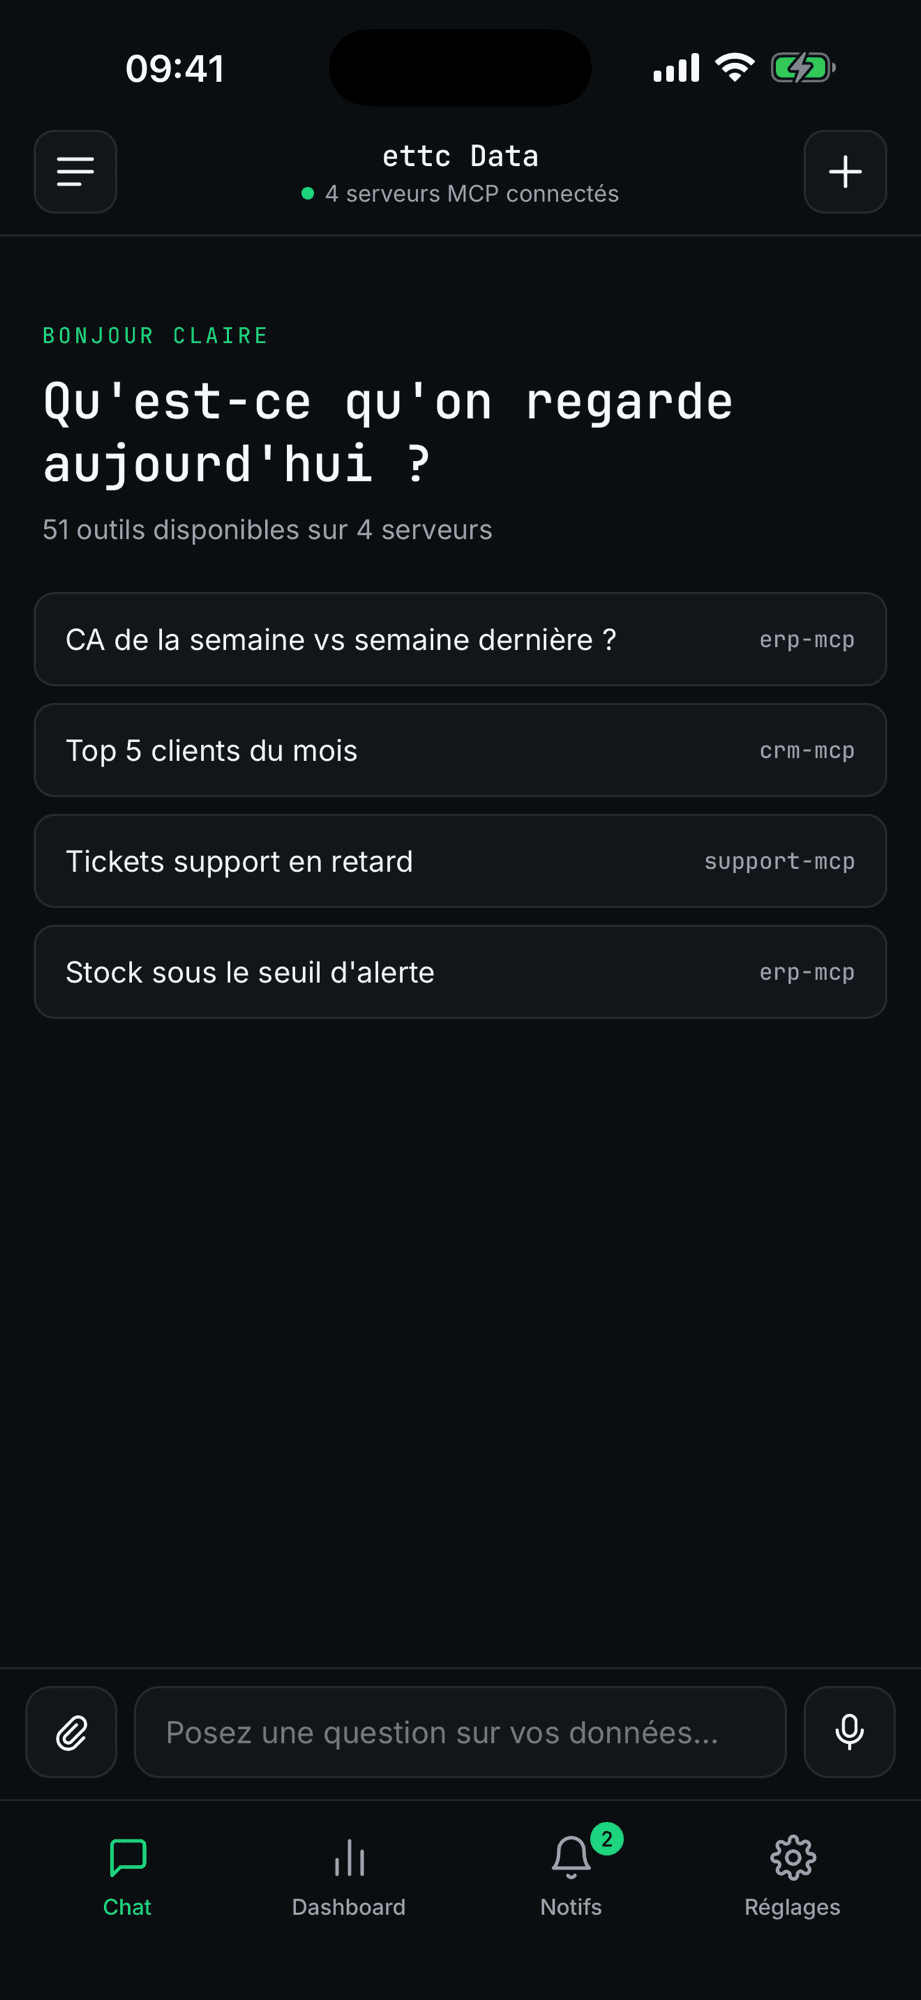
The scope is visible from the first screen: the questions covered, and the source answering each one.
Why the model calculates nothing
The language model understands the question and maps it to a business calculation defined and validated in advance. It does no arithmetic on your data. The figure on screen comes from your warehouse, with its source and its date.
That is what makes the app usable in front of a client or a banker: a question outside the scope gets "I do not have that data", not an approximation stated with confidence. The architecture behind it is on our engineering page.
How to get it
ettc Data is not sold on its own. It is the interface of the data foundation: without a reliable warehouse, it would have nothing true to show. Dashboards and alerts come with the foundation, the chat with the AI assistant, once the figures are reliable.
Built by the firm, delivered with our engagements.
Want to see your own figures in the app?
It all starts with the audit: which sources would feed the app, and what they are worth. Thirty minutes are enough to size the work.
Other tools
Jev Agent Builder
A visual editor for Jev, TypeSafe AI's decision model. You compose your questions in a form, and the JSON request for the API builds live, checked as you type.
Code2Form
Parametric 3D modelling software where the part is written as code, with a 3D view that follows as you type. It opens existing .scad files, checks electronic wiring before soldering, and can be driven by an AI agent.